40 queries for one dashboard: batching ClickHouse in Databuddy
The goals dashboard in Databuddy fired two ClickHouse queries per goal. I batched them into one, then a bot review found two ways my batch could break, and I had to fix both.
Databuddy is an open-source analytics platform that doesn't track people in creepy ways. I'd been reading through its code for a while, and then I hit goalsRouter.bulkAnalytics and stopped.
It's the endpoint behind the goals dashboard. You give it a website and a list of goal IDs, and for each goal it tells you how many visitors completed it. Simple job. The problem was how it did the job.
Two queries per goal, every time#
Here's roughly what it looked like before, in packages/rpc/src/routers/goals.ts:
const results = await Promise.all(
  goalsList.map(async (goal): Promise<[string, GoalAnalyticsResult]> => {
    const effectiveStartDate = getEffectiveStartDate(
      startDate,
      goal.createdAt,
      goal.ignoreHistoricData
    );
    // ...
    const filters = (goal.filters as Filter[]) || [];
    const combinedFilters = [...requestFilters, ...filters];

    try {
      const totalUsers = await getTotalWebsiteUsers(
        input.websiteId,
        effectiveStartDate,
        endDate,
        combinedFilters
      );
      const analytics = await processGoalAnalytics(
        steps,
        combinedFilters,
        { websiteId: input.websiteId, startDate: effectiveStartDate, endDate: `${endDate} 23:59:59` },
        totalUsers
      );
      return [goal.id, { ok: true, data: analytics }];
    } catch (error) {
      // log and return { ok: false } for this goal
    }
  })
);
So for every goal you get one query for the denominator (getTotalWebsiteUsers) and one for the completion count, all fired at once inside a Promise.all. With 20 goals, that's around 40 ClickHouse round-trips every time someone opens the dashboard.
It's the classic N+1, just dressed up as "concurrent" so it doesn't look like one. And most of those queries were asking the same thing. Goals on the same site usually share a date range and don't have filters, so the denominator came out the same every time. The completion queries were identical except for which event or path they matched.
That's exactly the kind of thing ClickHouse can answer in a single query with a GROUP BY.
I didn't jump straight into a PR. I opened issue #679 first, explaining the root cause and what I planned to do. It's someone else's codebase, so I wanted them to see the plan before a 500-line diff showed up.
The trap in the shared query builder#
The obvious move is to treat every goal as a "step" and push them all through the query builder the funnels feature already uses, buildIdentifiedEventStream. It already turns a list of steps into one event stream tagged with step numbers. Perfect.
Except it isn't quite. When I traced that builder, I found this:
let matches = baseMatch;
if (index === 0 && filters.length > 0) {
  if (step.type === "PAGE_VIEW") {
    matches = `${baseMatch}${browserFilter}`;
  } else {
    // ...custom event filter context
  }
}
return `if(ifNull(${matches}, false), toUInt8(${stepNumber}), toUInt8(0))`;
Filters only get applied to the step at index 0. For funnels that's correct: the entry filter gates step 1, and everything after is "what did those people do next". But if I batched filtered goals together as steps, every goal past index 0 would quietly lose its filter. You'd get a number back. It would just be the wrong one, and nothing would tell you.
I had two choices. Change the builder so filters work per step, or limit the batch to cases where the bug can't happen. The builder is shared with funnels, and a subtle bug there would hit a much bigger surface than a goals dashboard optimization is worth. So I left it alone and limited the batch: only goals with zero filters get batched, meaning no dashboard filter on the request and no filter on the goal. With an empty filter list, that index === 0 branch never runs, so every step's match condition looks the same no matter where it sits in the array.
Anything with a filter keeps the original one-query-per-goal path, unchanged.
The batched version#
The new query lives in packages/rpc/src/lib/analytics-utils.ts:
export const processGoalsConversionCountsBatch = async (
  steps: AnalyticsStep[],
  params: ClickhouseQueryParams,
  abortSignal?: AbortSignal
): Promise<Map<number, number>> => {
  if (steps.length === 0) {
    return new Map();
  }

  const query = `WITH ${visitorIdentityCtes},
${buildIdentifiedEventStream(steps, [], params)}
SELECT step AS step_num, uniqExact(vid) AS completions
FROM events
GROUP BY step_num`;
  // ...run it, map step_num -> completions
};
Unfiltered goals get grouped by their effective start date (some goals ignore data from before they were created, so they can't share a bucket with the rest). Each bucket gets one shared denominator call and one batched completion query. Goal i becomes step i + 1, and the router reads the result back with completionsByStep.get(index + 1) ?? 0. The ?? 0 matters: a goal nobody completed has no rows, so it isn't in the result at all.
The flow ended up like this:
bulkAnalytics
  -> load goals
  -> any request or goal filter?
       yes -> original per-goal query (unchanged)
       no  -> group by effective start date
                -> one denominator + one GROUP BY query per group
Here's what that means for an example dashboard with 20 goals:
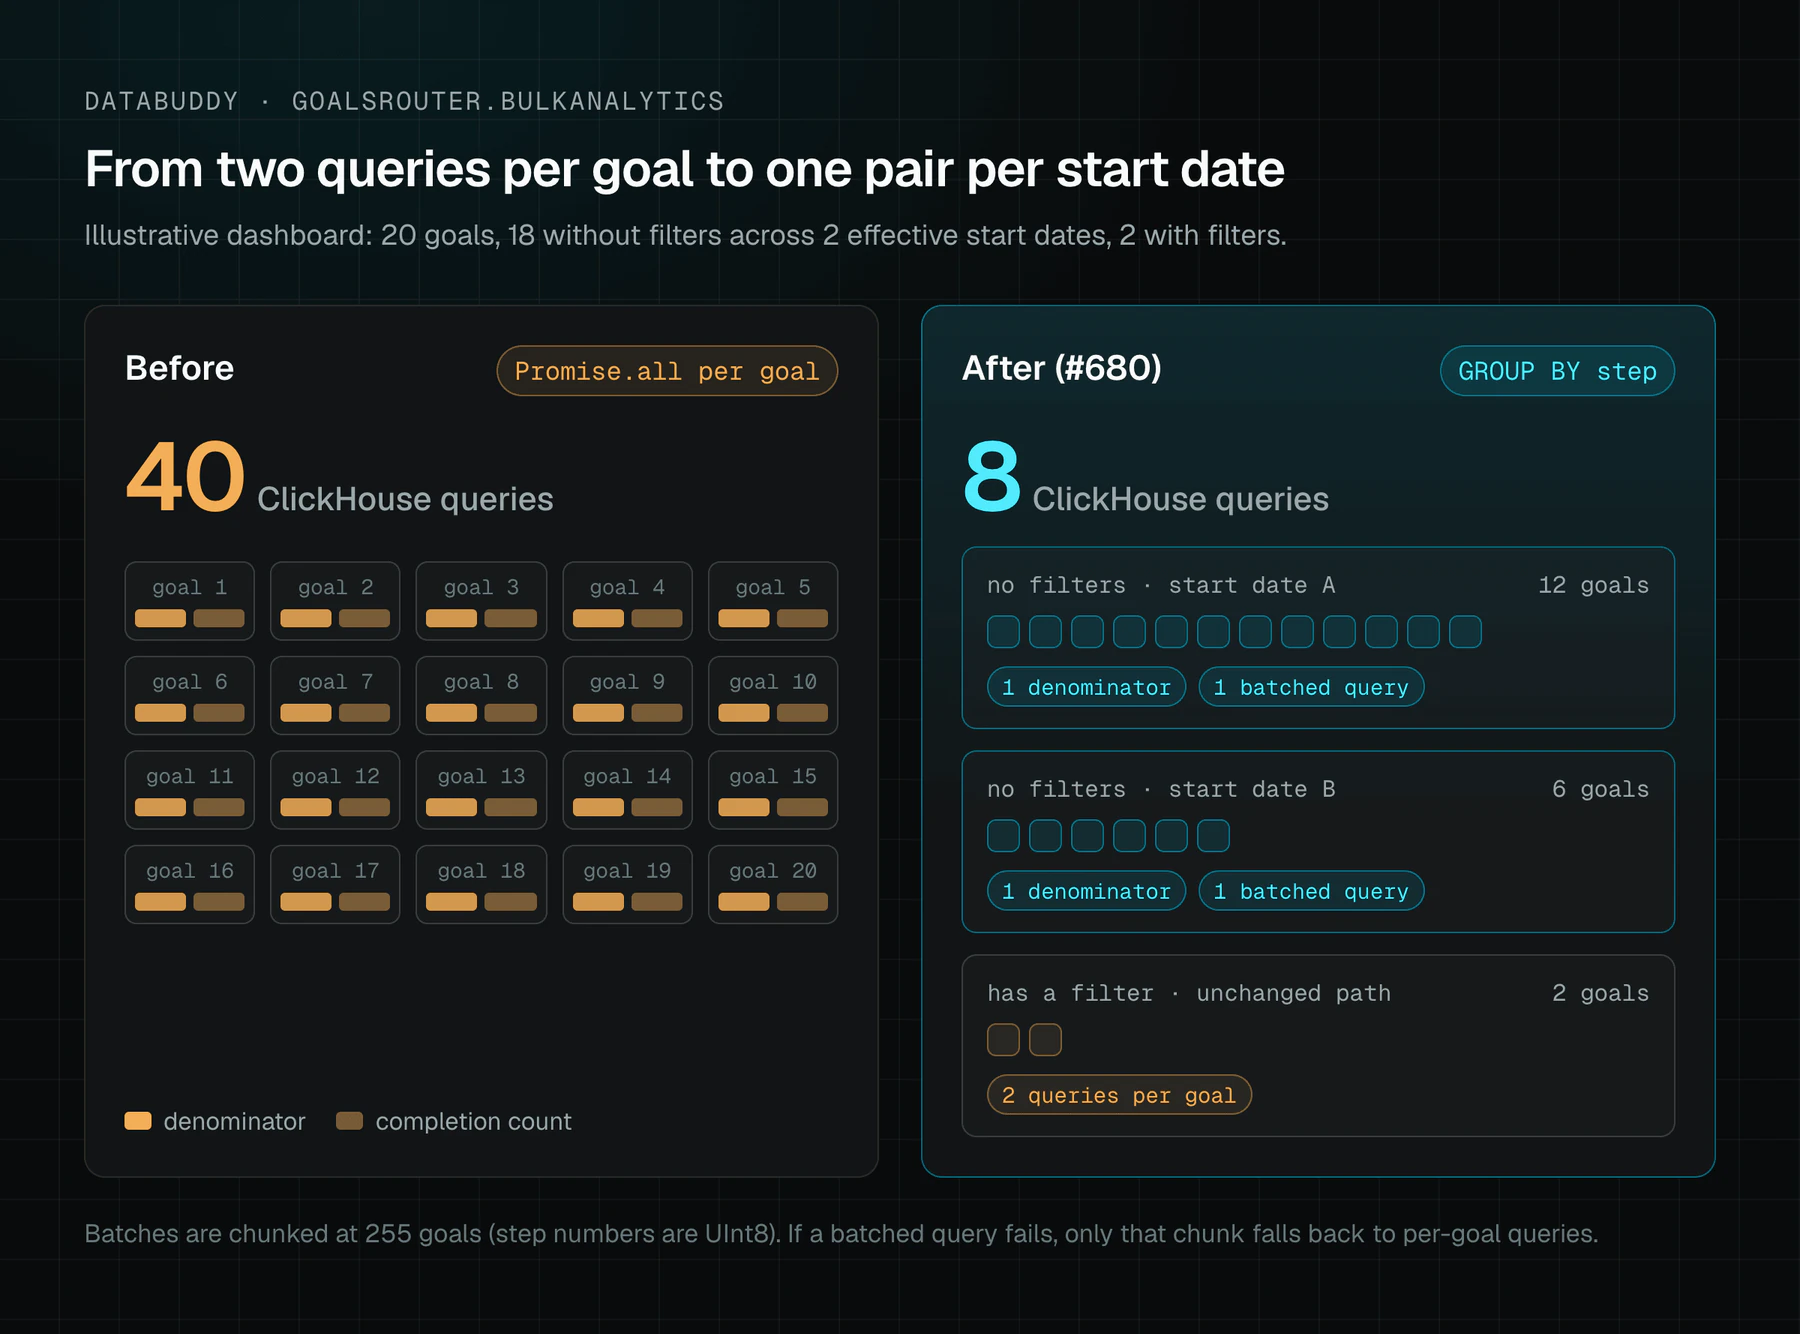
For a dashboard with mostly unfiltered goals, the query count now scales with the number of distinct start dates instead of the number of goals. I don't have production benchmarks for this, and I'm not going to make up a latency number. What I can say for sure is the query count: the unit test asserts one ClickHouse call for N goals, not N.
Then the review bot found two holes#
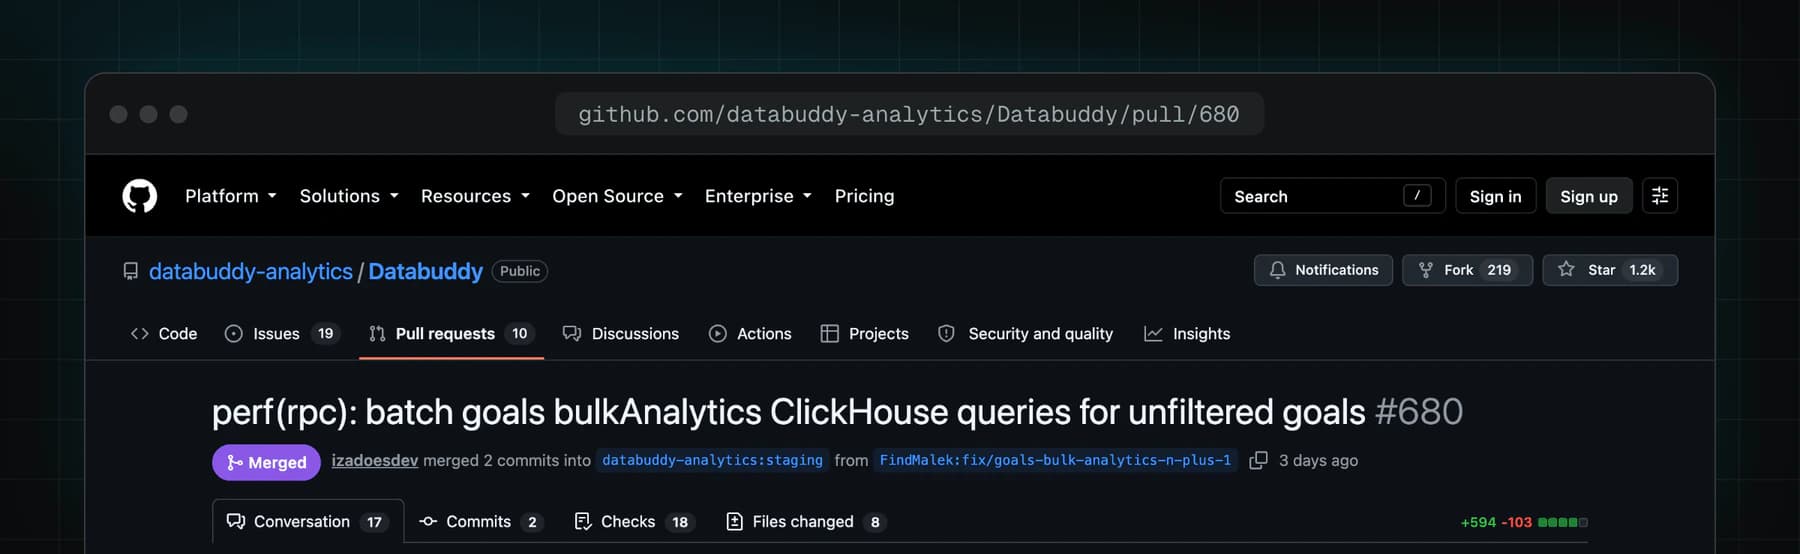
I opened #680 and the repo's review bot came back with two findings. Both were real, and both were my fault.
Step numbers overflow. Look at that builder line again: toUInt8(${stepNumber}). Step numbers are UInt8 in ClickHouse, which tops out at 255. For funnels that's fine, because nobody builds a 300-step funnel. But I was now using step numbers as goal IDs inside a batch. On a plan that allows enough goals, goal 256 wraps to 0, which the query treats as "didn't match". Goal 257 wraps to 1 and gets counted together with goal 1. Wrong numbers, no error. Same failure as the filter trap, just from another direction.
One bad query takes out every goal in the bucket. My first version's catch did this:
} catch (error) {
  logger.error({ /* ... */ }, "Failed to process batched goal analytics");
  for (const goal of groupGoals) {
    analyticsByGoal[goal.id] = {
      ok: false,
      error: "Failed to process goal analytics",
    };
  }
}
Before my change, each goal failed on its own. After it, one failed batched query marked every goal in the bucket as broken. I'd made the fast path faster and the failure path worse, without noticing.
The follow-up commit, fix(rpc): cap goal batch size and isolate batched query failures, fixed both. I moved the grouping into a pure function, groupGoalsForBulkAnalytics in its own file, with its own tests, and made it chunk every date bucket into groups of at most 255:
const batchChunks: BatchChunk<TGoal>[] = [];
for (const [effectiveStartDate, groupGoals] of batchGroups) {
  for (let i = 0; i < groupGoals.length; i += chunkSize) {
    batchChunks.push({
      effectiveStartDate,
      goals: groupGoals.slice(i, i + chunkSize),
    });
  }
}
And when a batched query fails, only that chunk falls back to the original per-goal path:
} catch (error) {
  logger.error(
    { /* ... */ goalIds: chunkGoals.map((goal) => goal.id) },
    "Batched goal analytics query failed; falling back to per-goal queries"
  );
  await Promise.all(
    chunkGoals.map((goal) => runGoalIndividually(goal, []))
  );
}
runGoalIndividually has its own try/catch, so a goal that fails even on its own still gets a clean error result instead of crashing the whole request. Worst case, you're back to the old behavior for one chunk. You never end up worse than before.
What the maintainer checked#
The maintainer, @izadoesdev, approved it with a long review that traced every changed line. It checked the ClickHouse SQL against the UInt8 encoding, the result mapping, the 255 cap, the fallback isolation, and the filter routing, and left three non-blocking nits: a redundant toUInt8(step) cast in my query (the step was already a UInt8 from the builder), a forEach where the project's lint rules want for...of, and no test for the fallback path.
Then it sat for a few weeks while staging moved on. When the review picked back up, the batching logic still held up, but the PR needed a rebase. Other commits had touched the same code, including a memoizedTotalUsers helper on the per-goal path that already removed some duplicate denominator calls. There was also a test script in package.json that still pointed at a file that no longer existed.
So I rebased, kept staging's memoization and logging, fixed all three nits, typed filters as DataFilter[] | null instead of unknown, and added two tests I should have written in the first place. One checks that when the batched query rejects, each goal is answered by the per-goal path with its own filters. The other is a ClickHouse integration test asserting that batched counts equal per-goal counts across profile, session, and reassigned-browser visitors.
The final comment said it was verified locally (rpc type check, 228 unit tests, and the new integration test at 18/18 against a local ClickHouse), and then it was merged.
The other two that landed#
Before this one I had two smaller PRs merged.
#636 was a cache bug with a stale TODO on top. All three funnel read paths had caching turned off with disabled: true, // TODO: Remove this once we have a way to invalidate the cache. The invalidation function already existed, but getById cached under byId:${id} while invalidation deleted byId:${funnelId}:${websiteId}. The keys never matched. I aligned the key and turned caching back on, and the bot caught that the only workspace auth check was inside the cached function, so a cache hit would skip it. Moving auth ahead of the cache fixed that. Another "I made it faster and quietly made it worse" moment, caught before merge.
#637 added a Discord notification provider. The package's TODO.md claimed Discord was done, but no code existed. I built it on the same shape as the Slack provider and enforced Discord's embed limits, including the 6000-character total limit I missed on the first pass.
I've also got four more open right now: typed alarm trigger conditions (#988), an eval-only judge for insight claims (#989), a deterministic seed script (#990), and one registry for alarm destination types (#991).
What I'd tell myself before the first PR#
In your own codebase, you know which helpers have weird edges. In someone else's, you don't, and the weird edges are exactly where the bugs hide. The index === 0 filter branch and the UInt8 step number were both correct for what they were built for. They only broke when I used them for something new.
So now I do three things. I file the issue before the PR. I limit the change to the case I can actually prove is safe. And I write the parity test first, the one that says "batched output equals the old output", instead of adding it during a rebase three weeks later.
Oh, and read the review bot's comments properly. On this PR, both of its correctness findings were real bugs I had shipped.